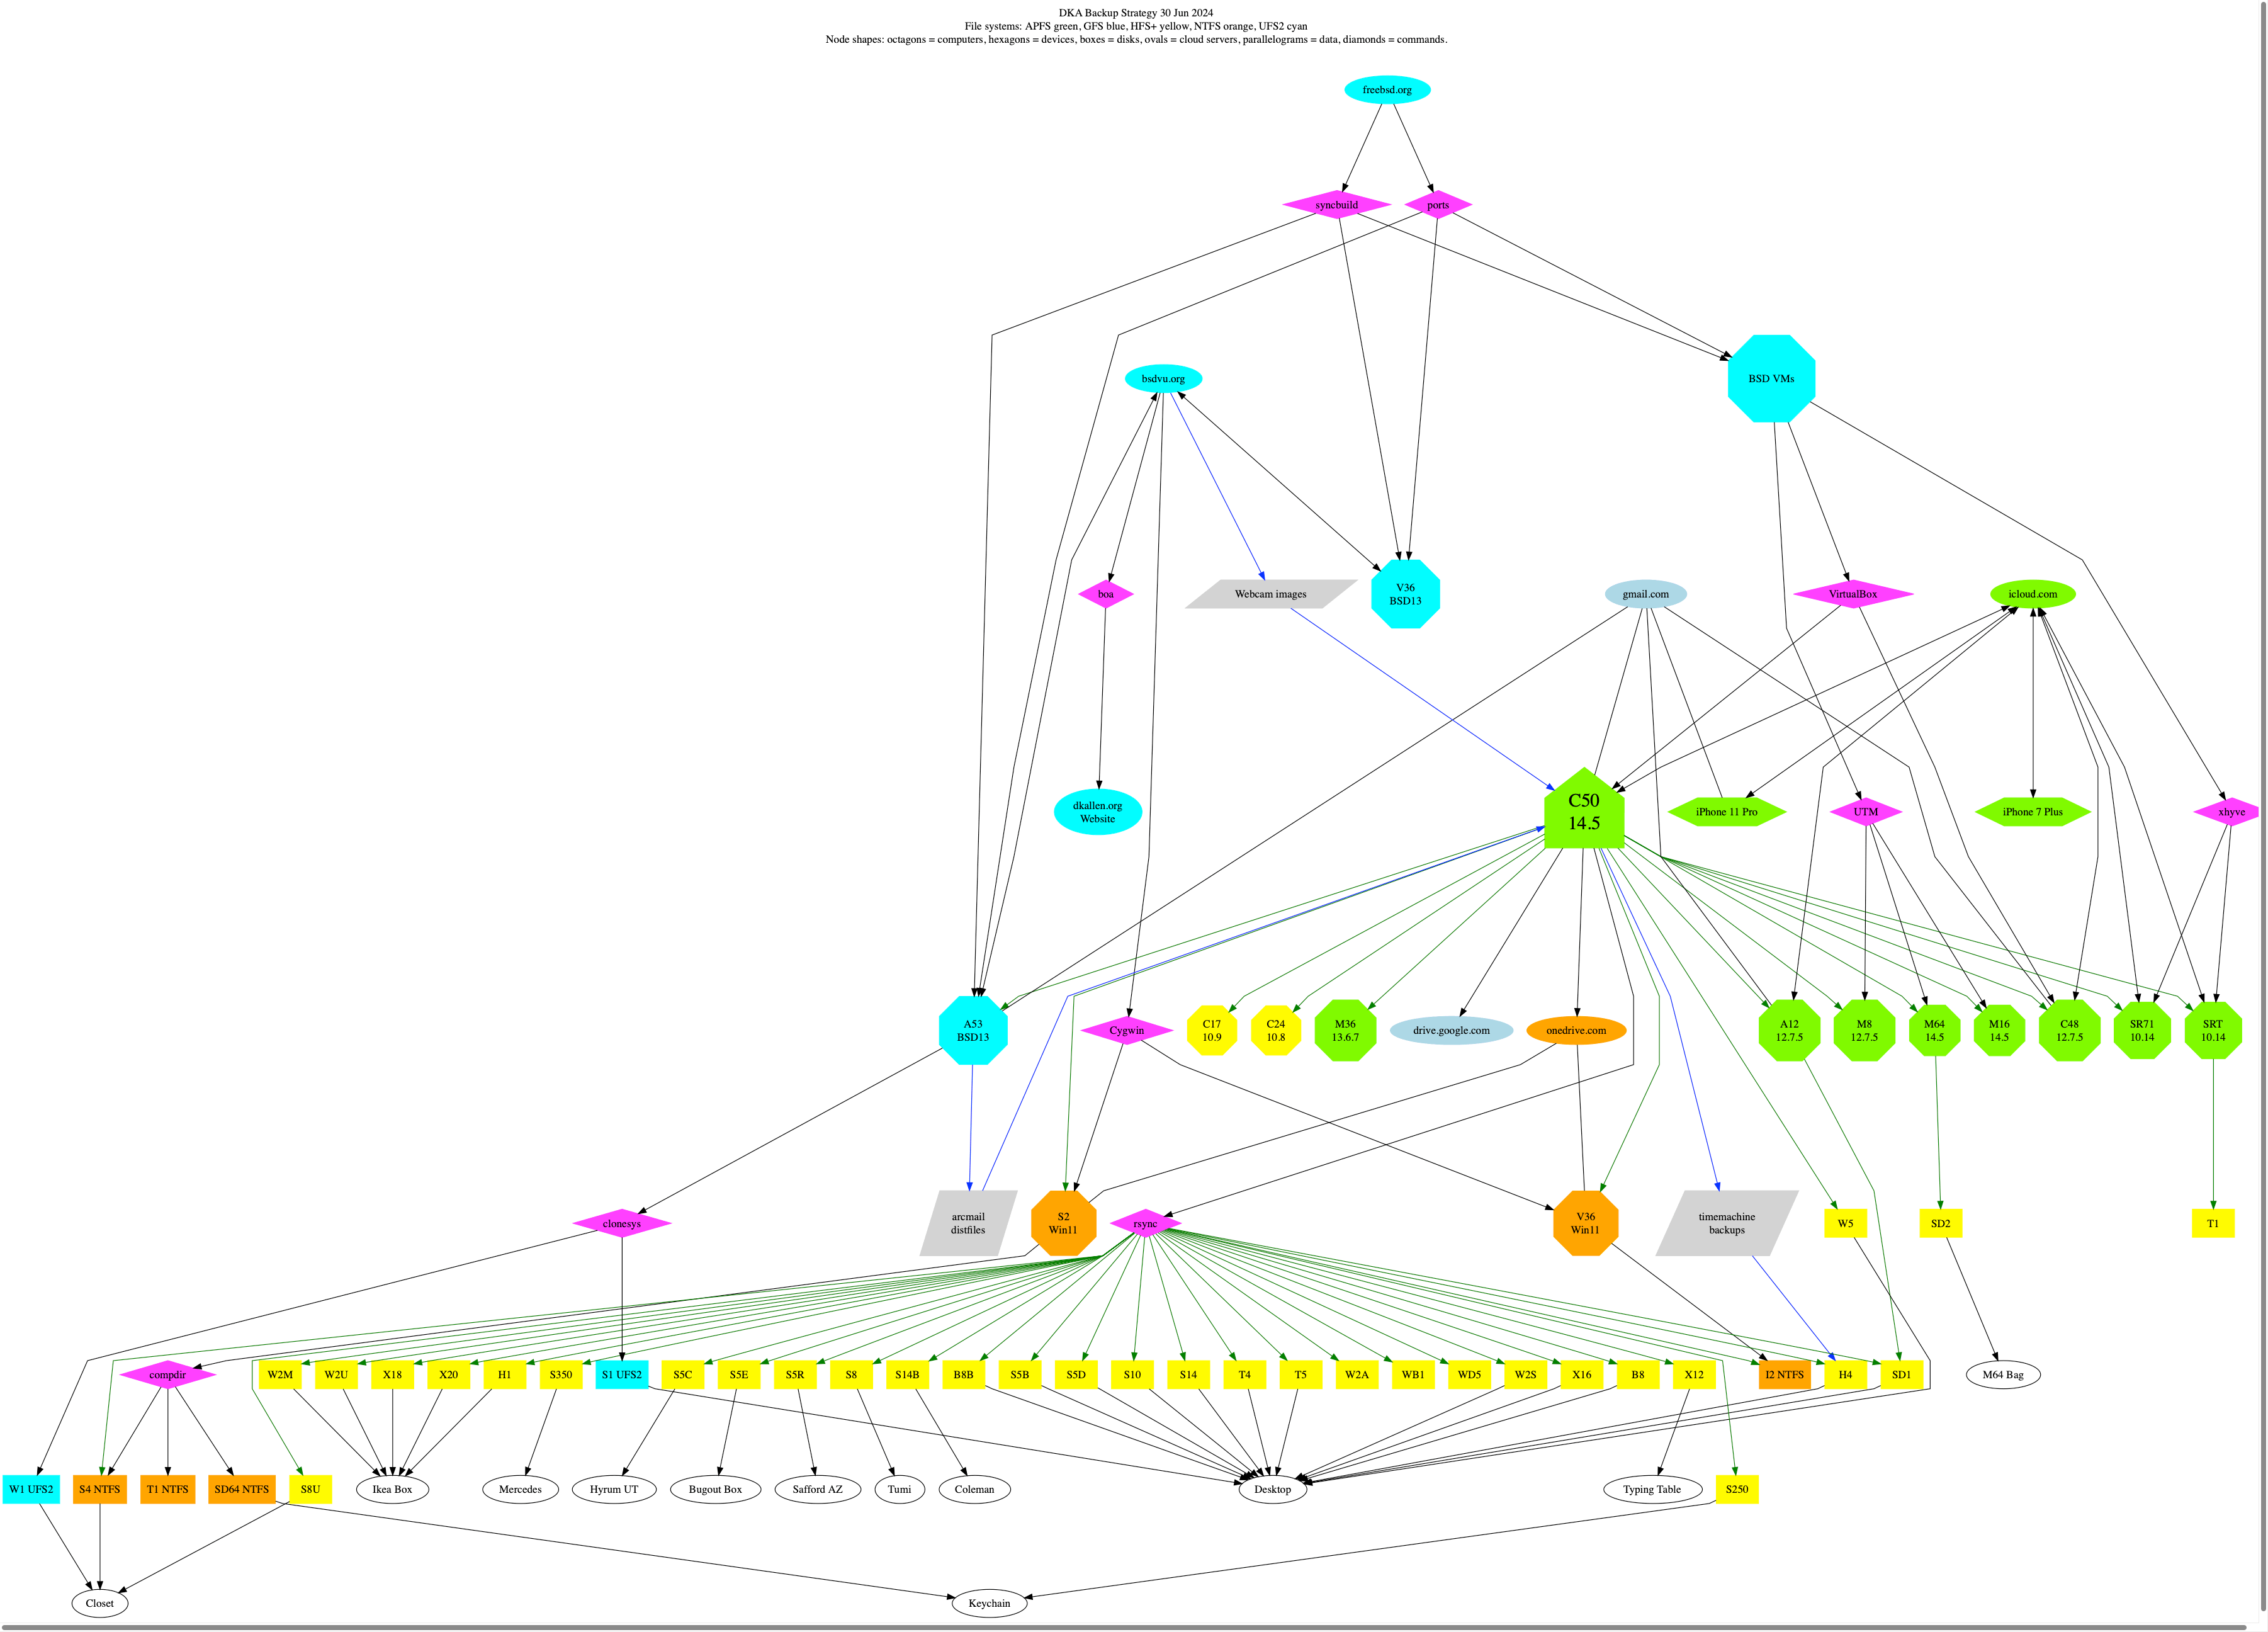
Here is a graph generated by the graphviz tool dot. It shows my computers, disks, and the data flows and commands that keep my data in sync and backed up. For redundancy I keep the files on a variety of file systems and OSes so that in case of a catastrophic failure on one kind of system, another is hoped to prevail.
The legend at the top of this diagram explains colors and shapes.
Click on the image twice to see the image at full scale.
Created:  25 Aug 2020
Modified: 30 Jun 2024